

- The Bitcoin price is currently moving in a narrow range. A larger price movement seems to be only a matter of time.
- Several price indicators are pointing to a bullish trend reversal. However, the BTC price continues to trade in a descending trend channel.
Since Bitcoin (BTC) dropped briefly to USD 6,500 at the end of November, analysts are wondering whether the bottom has really been reached. Currently, Bitcoin is trading at around 7,500 US dollars and is moving within a narrow range. A bigger move, either up or down, seems to be only a matter of time.
Some experts argue that Bitcoin is currently unable to break through the important resistance zone of 7,800 US dollars. Already on December 4th and twice at the end of November, BTC bounced off this mark. As a result, some experts currently believe that the chances of a bull run are rather low.
Other analysts, on the other hand, are currently seeing bullish signals that could herald a reversal of the downtrend that has been ongoing since the end of June, when the Bitcoin dropped from its annual high of 13,800 US dollars. As Willy Woo, co-founder of Adaptive Capital and a popular analyst on Twitter, wrote, a proprietary indicator from Adaptive Capital that measures the “investors momentum” shows a bullish reversal in the Bitcoin market.
On-chain momentum is crossing into bullish. Prep for halvening front running here on in. Can't say what this indicator is, as it's proprietary to @AdaptiveFund, but it tracks investor momentum. The bottom is mostly likely in, anything lower will be just a wick in the macro view. pic.twitter.com/WqiPRpweUv
— Willy Woo (@woonomic) December 7, 2019
In addition, there are currently two other Bitcoin price indicators that give a bullish outlook. One of these price models is the much quoted Stock to Flow model, which measures the relation between the newly generated BTC by miners and the current supply and calculates the expected Bitcoin price from this data.
The indicator invented by the well-known Twitter analyst PlanB is controversial, not least because it predicts a BTC price of one million US dollars in 2025. However, the indicator has often been confirmed by the Bitcoin price in the past. Currently, the stock to flow model suggests that the BTC price should be above USD 10,600.
#Bitcoin halving .. 5 months to go 🚀
For miners: production cost of 1 btc will double
For investors: stock-to-flow (unforgeable scarcity, inability to inflate stock) will double pic.twitter.com/JWNbJyil4a
— PlanB (@100trillionUSD) December 1, 2019
Another model that points to a rising Bitcoin price is the Market Value to Realized Value (MVRV) indicator. The indicator introduced by the analysis company Glassnode measures the ratio between market cap and “realised cap”. This figure is currently consolidated towards a value of 1 what could mean that the bottom has been reached.
1/ Weekly on–chain market observations:
The bottom is close – and once it happens, the reversal will be strong.
MVRV is consolidating towards 1, which historically has indicated the bottom of #Bitcoin market cycles. Patience is key.https://t.co/lv8knFD0wV pic.twitter.com/7kwckER6Ri
— glassnode (@glassnode) December 7, 2019
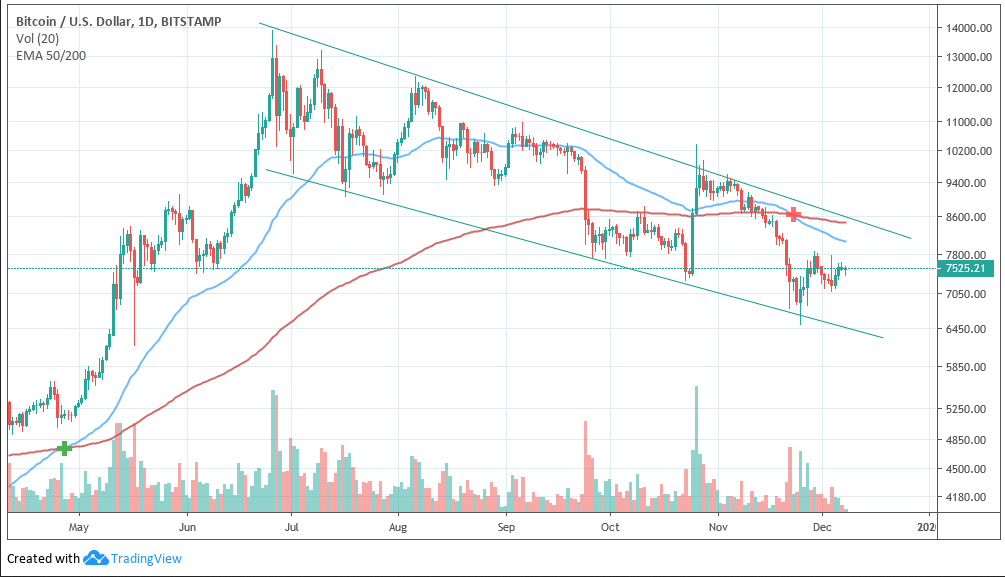
Bitcoin still in a descending trend channel
Although many indicators currently provide a bullish outlook, Bitcoin is still in a downward trend channel on the 24-hour chart, with Bitcoin reaching lower highs and lows. However, the Bitcoin price has temporarily bottomed out at USD 6,500. Since then, Bitcoin has been trading in the 6,800 and 7,800 USD range. In order to gain bullish momentum, Bitcoin has to break through the 7,800 USD mark and rise permanently above 8,000 USD.
Another factor that could have had a significant impact on the Bitcoin price in recent months is the open interest on the crypto-derivative platform BitMEX. As the analyst Mohit Sorout recently stated, there could be a close connection between the open interest on BitMEX and the Bitcoin price. If open interest at BitMEX rises above 100,000 BTC, there has always been a larger price movement in the past, up or down. This subsequently set the trend for the coming weeks, Sorout said. Currently, Open Interest is building up again.
Expect price to consolidate for weeks while OI creeps above 100k BTC building up to the next explosive move.
This has been the theme for a while, no reason why it would be different this time.
Knowing when to position yourself for volatility is key. pic.twitter.com/NrH1CQT2sb
— Mohit Sorout 📈 (@singhsoro) December 5, 2019
Follow us on Facebook and Twitter and don’t miss any hot news anymore! Do you like our price indices?
Recommended for you:
- Buy Bitcoin Guide
- Bitcoin Wallet Tutorial
- Check 24-hour Bitcoin Price
- More Bitcoin News
- What is Bitcoin?
Subscribe to our daily newsletter!
No spam, no lies, only insights. You can unsubscribe at any time.


 Climbs As Biden Resigns: White House Sparks Historic Bull Run With Ethereum (ETH) and RollBlock (RLBK) Feeling The Pump!")